


Pendahuluan
Laporan Intelijen Domain Q2 2026 menganalisis harga penjualan aftermarket dari data marketplace Dynadot sendiri, April–Juni 2026, dibandingkan dengan Q2 2025. Laporan ini mengedepankan median dan melaporkan pangsa, rasio, dan nilai indeks, sehingga setiap temuan dapat dikutip.
Q2 menyaksikan harga jual tipikal tetap stabil, dengan nilai terkonsentrasi di kedua ujung pasar dan nama premium yang sebagian besar ditentukan oleh strukturnya. Cerita kuartal ini adalah tentang penetapan harga dan komposisi, yang membuatnya berguna untuk dibaca bagi siapa saja yang memutuskan bagaimana menetapkan harga, mendaftar, atau menawar. Ini ditulis untuk investor domain, profesional penamaan, dan analis yang mencari tolok ukur harga yang transparan.
Laporan ini mencakup:
- Harga median vs. rata-rata, tahun ke tahun
- Konsentrasi nilai berdasarkan kelompok harga
- TLD, panjang, dan sinyal penamaan
- Kesamaan penjualan premium
- Sinyal kualitas yang memengaruhi harga
Ringkasan Eksekutif
Kuartal 2 2026 dibentuk oleh penetapan harga dan bauran penjualan, menyoroti harga jual tipikal, tempat nilai pasar sekunder terkonsentrasi, dan ciri-ciri yang dimiliki bersama oleh domain bernilai tertinggi. Empat temuan mendefinisikan kuartal ini:
- Harga jual tipikal tetap stabil dari tahun ke tahun. Mediannya adalah $18.87 hampir persis seperti pada Q2 2025 - $18.85. Campuran listing bergeser ke inventaris berharga lebih rendah; domain tipikal tetap terjangkau.
- Nilai berada di kedua ujung pasar. Sekitar 89% pesanan selesai di bawah $50, dan kelompok itu serta puncak pasar menyumbang porsi nilai total yang sebanding.
- Penjualan premium memiliki profil yang berbeda. Di antara penjualan di atas $5,000, tidak ada satu pun domain yang menggunakan tanda hubung atau diinternasionalisasi, dan hampir 58% memiliki lima karakter atau kurang, dibandingkan dengan 13.1% penjualan di bawah $50.
- Struktur menandai tingkat premium lebih jelas daripada topiknya. Sinyal yang membedakan puncak pasar adalah pendaftaran lintas TLD: nama premium sudah terdaftar di banyak ekstensi lain.
Angka-angka kunci sekilas
| Sinyal | Angka yang Dilaporkan (Q2 2026) |
| Harga jual median Pertumbuhan, tahun demi tahun | $18.87 vs $18.85 (+0.1%) |
| Pangsa pesanan yang ditutup di bawah $50 | 88.9% |
| Pangsa .com dari pesanan aftermarket | 70.6% |
| Pangsa .com dari penjualan di atas $5,000 | 60.0% |
| Penjualan di atas $5.000 yang panjangnya 5 karakter atau kurang | 57.5% |
| Median pendaftaran lintas-TLD, penjualan $5.000+ vs semua penjualan | 26 vs 2 |
Metodologi
Data pasar
Analisis ini menggunakan lebih dari 54.000 penjualan aftermarket yang selesai pada Q2 2026.
Cara membaca angka-angka
Median memimpin di seluruh bagian, karena rata-rata bergerak setiap kali komposisi listing berubah. Rata-rata diberi label di mana pun dikutip, dan rasio indeks dibulatkan.
Data usia, backlink, dan lintas-TLD tidak disediakan untuk backorder, jadi backorder tidak disertakan dalam setiap analisis kualitas (ini dinyatakan di tempat yang relevan). Edisi ini tidak melaporkan geografi pembeli, karena kumpulan data tidak berisi sinyal lokasi yang andal.
Karakteristik penjualan premium menggambarkan penjualan yang terjadi. Ini bukan pernyataan sebab, dan tidak ada apa pun dalam laporan ini yang merupakan saran tentang apa yang harus dibeli atau didaftarkan.
1. Penetapan Harga Domain di Pasar Kami
Domain tipikal terjual dengan harga yang sama seperti setahun lalu: median hanya bergeser sepersepuluh persen, dari $18,85 menjadi $18,87.
Harga jual median tetap stabil dari tahun ke tahun, sementara transaksinya bergeser ke penjualan berharga lebih rendah. Ketika median tetap stabil dan rata-rata bergerak, biasanya komposisilah yang berperan. Q2 2025 membawa ekor yang lebih berat dari penjualan yang sangat besar, sedangkan Q2 2026 membawa basis inventaris berharga lebih rendah yang lebih luas ke pasar. Harga yang dibayar pembeli untuk nama-nama yang sebanding tetap bertahan; komposisi dari apa yang terjual berubah.
2. Bagaimana Harga Pesanan Membentuk Volume dan Nilai Aftermarket
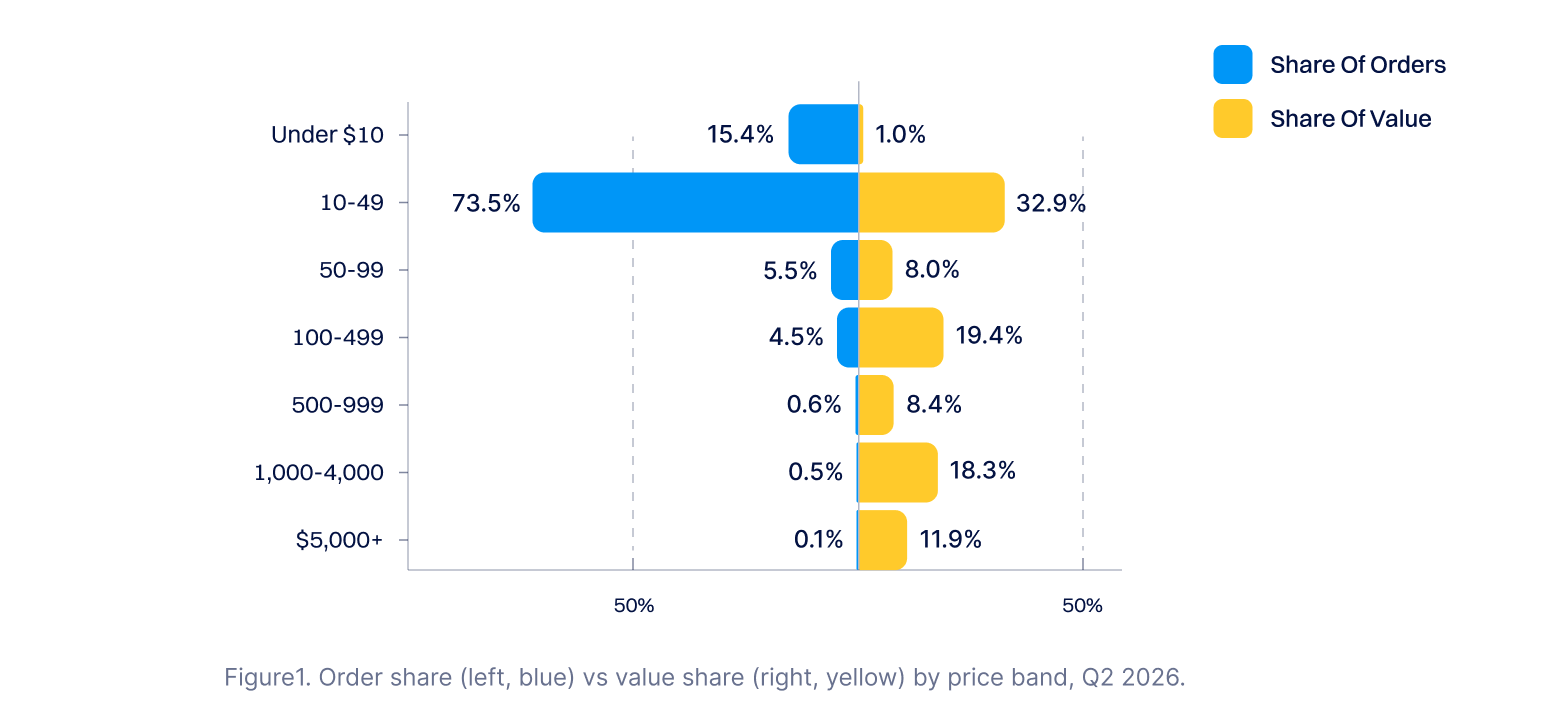
Kurang dari 1% pesanan aftermarket menghasilkan hampir sepertiga nilai marketplace, dan seluruh lapisan di bawah $50 juga begitu.
- Puncak pasar: pesanan di atas $5,000 sekitar tujuh dari sepuluh ribu, dan membawa 11.9% dari nilai sendiri.
- Tingkat volume: 88.9% pesanan di bawah $50 menghasilkan 33.9% dari nilai.
- Tingkat $1,000+: Kurang dari 1% pesanan, menyumbang hampir sepertiga nilai.
Dasar pasar dan puncak pasar berkontribusi kurang lebih sama, dari basis yang terpaut tiga orde besaran. Pasar sekunder terbaca sebagai bisnis volume dan sekaligus berperilaku seperti bisnis ekor panjang, itulah sebabnya ringkasan dengan metrik tunggal cenderung melewatkan separuh gambaran.
Di mana pesanan berada vs di mana nilai berada, Q2 2026
3. TLD, Panjang, dan Sinyal Penamaan
Pilihan TLD dan panjang nama sama-sama membentuk harga, meskipun beberapa sinyal penamaan lebih berpengaruh daripada yang lain.
.com memimpin volume transaksi
.com menyumbang tujuh dari sepuluh pesanan, dan 354 TLD berbeda diperdagangkan di Q2 2026. Volume dan harga peringkatnya hampir berbanding terbalik: .com memegang 70.6% pesanan dengan sekitar 1.0x rata-rata pasar, karena di sinilah ujung pasar dengan volume tinggi dan harga lebih rendah bertransaksi, sementara ekstensi dengan harga tertinggi masing-masing berada di bawah 1% dari volume.
.io adalah kisah premium yang jujur di sini, dengan median $61.49, lebih dari tiga kali median pasar.
.us menunjukkan rata-rata 2.74x tetapi median $14.95; rata-rata itu didorong oleh beberapa penjualan besar dan tidak boleh dikutip sendiri.
| TLD | Bagian dari pesanan | Median | Rata-rata vs pasar |
| .com | 70.6% | $18.87 | ~1.0x |
| .org | 6.4% | $18.52 | ~0.9x |
| .cc | 4.1% | $16.79 | ~0.5x |
| .net | 3.9% | $20.51 | ~0.9x |
| .io | 0.6% | $61.49 | ~2.9x |
| .us | 0.6% | $14.95 | ~2.7x (didorong ekor) |
Nama pendek mengangkat harga puncak
Panjang adalah salah satu pola penetapan harga paling jelas kuartal ini, tetapi bekerja dengan cara yang lebih spesifik daripada "lebih pendek lebih mahal." Berikut rincian angkanya:
- Premi nama pendek: Nama dengan 1 hingga 5 karakter rata-rata sekitar 1.6x harga pasar, premi panjang terkuat dalam kumpulan data.
- Kurva: nilainya turun secara stabil seiring nama menjadi lebih panjang, mencapai titik terendah pada rentang 11-15 karakter di sekitar 0.8x.
- Ekor panjang: setelah 15 karakter kurvanya mendatar, dan nama dengan 21+ karakter dihargai sedikit di atas rentang 16-to-20.
- Berdasarkan kanal: efeknya paling tajam di lelang pengguna dan paling ringan di lelang kedaluwarsa.
- Mediannya: $18.87 di setiap kelompok panjang, nuansa yang terlewat oleh sebagian besar analisis panjang.
Apa arti poin terakhir itu dalam praktik? Rata-rata naik untuk nama pendek, tetapi harga jual tipikal tetap. Keringkasan tidak membuat penjualan biasa lebih mahal, itu meningkatkan peluang penjualan yang luar biasa. Nama pendek menaikkan plafon harga jual domain, bukan lantai harga biasanya.
Angka dibanderol tinggi, tanda hubung dibanderol rendah
Dua pola penamaan jelas terlihat di Q2, satu di setiap arah.
Label numerik murni jarang tetapi bernilai. Domain yang seluruhnya terdiri dari angka menyumbang 0.6% dari pesanan, dan rata-rata sekitar 2.5x harga pasar.
Nama dengan tanda hubung diperdagangkan di bawah pasar. Domain yang mengandung tanda hubung mencakup 5.0% pesanan dan rata-rata sekitar 0.7x harga pasar, jadi penjual yang menetapkan harga inventaris bertanda hubung harus membandingkannya dengan rentang itu, bukan dengan rata-rata pasar secara keseluruhan. Pembeli secara konsisten membayar lebih sedikit untuk nama yang dipecah oleh tanda baca.
Di antara tema kata kunci, hanya tiga yang dihargai secara signifikan di atas pasar:
- energi hijau pada 1.36x
- agen dan bot di 1.17x
- teknologi umum pada 1.14x
Setiap tema kata kunci lainnya dihargai pada atau di bawah pasar.
Bagaimana penamaan AI terlihat di Q2
Ini mengukur string kata kunci AI di dalam nama domain di semua ekstensi. Ini bukan pembacaan atas ekstensi .ai, yang dilaporkan secara terpisah di bawah ini.
Domain yang mengandung kata kunci AI dihargai sejalan dengan pasar pada Q2: rata-ratanya berada di sekitar 1.0x harga pasar, dan mediannya, $18.87, persis sama dengan median pasar. Karena kata kunci AI muncul pada nama di setiap rentang harga dan setiap ekstensi, kata kunci itu sendiri tidak menggeser harga penjualan tipikal.
Satu catatan tentang cara kami menghitungnya: hanya mencari "ai" di dalam sebuah nama menghasilkan terlalu banyak kecocokan, karena kata seperti chair, email, dan domain semuanya ikut cocok. Kami menggunakan pencocokan tingkat kata, yang tetap menangkap nama AI asli seperti aitools.com.
Pada ekstensi .ai itu sendiri: .ai muncul di ujung premium pada kuartal ini, termasuk salah satu dari sepuluh penjualan terbesar Q2. Kami tidak menerbitkan indeks tingkat ekstensi untuk .ai pada edisi ini, karena volumenya cukup tipis sehingga sejumlah kecil penjualan besar mendominasi rata-rata apa pun dan angkanya tidak akan menjadi tolok ukur yang andal.
4. Karakteristik Umum Penjualan Premium
Domain termahal pada kuartal ini tampak sangat mirip: pendek, bersih, dan tanpa tanda hubung.
Penjualan terbesar kuartal ini
| Penjualan teratas | Domain | Harga | Jenis daftar | Bulan |
| #1 | tenvels.com | $25,000.00 | Buy-It-Now | Juni |
| #2 | betzz.com | $15,210.88 | Lelang kedaluwarsa | April |
| #3 | personio.ai | $13,023.61 | Lelang pengguna | April |
| #4 | 2290.com | $12,909.88 | Lelang kedaluwarsa | Mei |
| #5 | 5jl.com | $10,211.02 | Lelang kedaluwarsa | April |
| #6 | glws.com | $9,999.00 | Buy-It-Now | Juni |
| #7 | 4439.com | $9,910.88 | Lelang kedaluwarsa | April |
| #8 | tgh.com | $9,772.80 | Backorder | Mei |
| #9 | dyno.org | $8,888.00 | Buy-It-Now | Mei |
| #10 | d43.com | $8,888.00 | Buy-It-Now | Juni |
Karakteristik bersama berdasarkan kelompok harga
Di antara penjualan terbesar Q2, tidak ada satu pun domain yang menggunakan tanda hubung, dan lebih dari separuhnya memiliki lima karakter atau lebih pendek.
Setiap gradien di bawah ini bergerak ke satu arah saat harga naik.
| Karakteristik | Semua pesanan | Di bawah $50 | $1,000+ | $5,000+ |
| Panjang label rata-rata | 10.2 | 10.4 | 8.6 | 6.0 |
| 5 karakter atau kurang | 14.0% | 13.1% | 26.8% | 57.5% |
| Numerik murni | 0.6% | 0.6% | 1.4% | 5.0% |
| Bersifat tanda hubung | 5.0% | 5.2% | 3.4% | 0.0% |
| Internasionalisasi (IDN) | 0.4% | 0.4% | 0.3% | 0.0% |
| pangsa .com | 70.6% | 71.6% | 61.9% | 60.0% |
| Terjual melalui Beli-Langsung | 15.7% | 16.5% | 39.5% | 60.0% |
| Median pendaftaran lintas‑TLD | 2 | 1 | 7 | 26 |
Apa yang berubah saat harga naik: Karakteristik berdasarkan kelompok harga, Q2 2026
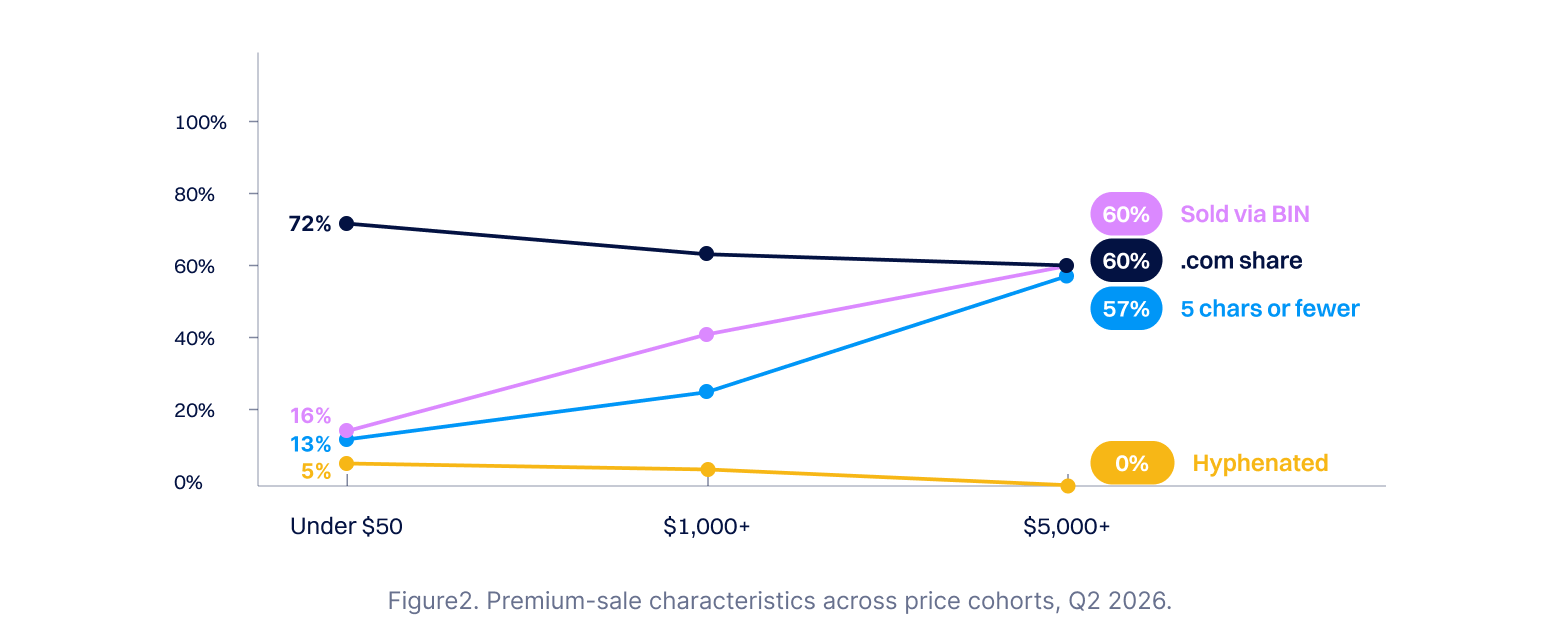
Membaca tabel dari sinyal terkuat ke bawah:
- Keringkasan adalah penanda yang paling jelas. Bagian nama dengan lima karakter atau lebih pendek meningkat lebih dari empat kali lipat antara tier dasar dan tier teratas.
- Tanda hubung dan IDN tidak ada di atas $5,000. Mereka makin jarang di tingkat menengah dan mencapai nol di puncak.
- Pendaftaran lintas TLD memisahkan tingkatan. Nama premium sudah terdaftar di 26 TLD lain, dibandingkan 2 di seluruh pasar.
- Buy-It-Now membawa tingkat premium. Ini menyumbang 60% dari penjualan di atas $5.000, dibandingkan 16.5% dari segmen bawah $50, yang menjadikannya kanal tempat nama bernilai tinggi paling sering terjual.
- Ujung premium lebih beragam TLD. Porsi .com menurun dari 71.6% di dasar menjadi 60.0% di puncak, jadi ekstensi non-.com lebih terwakili di antara penjualan terbesar daripada di antara yang terkecil.
5. Sinyal Kualitas Apa yang Sebenarnya Menggerakkan Harga
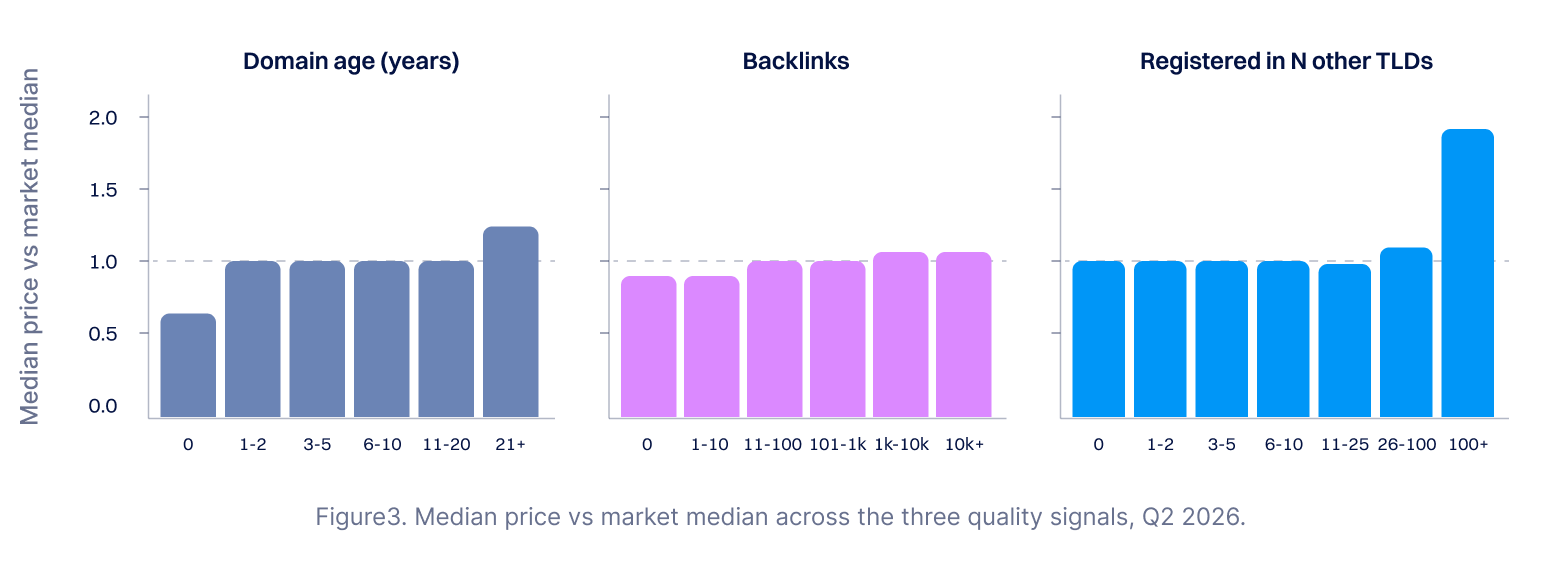
Bagian ini hanya mencakup penjualan kedaluwarsa, BIN, dan lelang pengguna. Backorder dikecualikan karena data usia, backlink, dan lintas-TLD tidak disediakan untuk kanal tersebut. Angka-angka merupakan median per kelompok, bukan rata-rata, karena distribusi harganya cukup lebar sehingga rata-rata menyesatkan.
Sinyal kualitas dan harga jual tipikal, Q2 2026 (backorder tidak termasuk)
Usia menunjukkan korelasi yang terbatas dengan penjualan tipikal
Usia domain hampir tidak membuat perbedaan pada harga jual biasanya. Dari usia 1 tahun hingga 20 tahun, harga median berada tepat di median pasar tanpa gradien. Hanya dua ujung rentang yang berperilaku berbeda: nama yang baru atau baru direset terjual sekitar 0.6x harga pasar, dan nama yang lebih tua dari 21 tahun memiliki premi moderat sekitar 1.3x.
Kesimpulannya adalah bahwa usia meningkatkan peluang penjualan luar biasa, bukan harga untuk penjualan biasa. Domain yang lebih tua memiliki lebih banyak waktu untuk mengumpulkan apa pun yang membuat nama bernilai, tetapi dengan sendirinya, usia bukanlah yang dibayar pembeli.
Backlink menunjukkan korelasi terbatas dengan harga.
Nama tanpa tautan dihargai sedikit di bawah median pasar (pada ~0.9x), dan setelah ambang itu, pergerakannya sangat lambat. Nama dengan sepuluh ribu backlink memiliki median hanya 5% di atas nama dengan lima puluh.
Kelompok premium menunjukkan arah yang sama, dengan median 14 tautan di antara penjualan $5,000+ dibandingkan 18 di seluruh pasar. Untuk pasar yang sering mencantumkan jumlah tautan dalam listing, itu layak diketahui saat Anda mempertimbangkan berapa yang harus dibayar.
Pendaftaran lintas TLD adalah sinyal yang berhasil, dan perilakunya seperti ambang batas
Jumlah pendaftaran lintas-TLD mengukur berapa banyak ekstensi lain yang sudah mendaftarkan nama yang sama. Efeknya, ini adalah ukuran berapa banyak orang lain yang menginginkan string itu.
Ia berperilaku seperti ambang batas, bukan lereng yang bertahap. Di bawah 26 pendaftaran lain, jumlahnya tidak banyak memberi tahu Anda tentang harga. Setelah titik itu, nilai median mulai menanjak, dan nama yang terdaftar di lebih dari 100 ekstensi lain terjual hampir dua kali lipat harga tipikal.
Ini juga satu-satunya sinyal kualitas yang tetap bekerja di puncak pasar. Penjualan median $5.000+ tercatat di 26 TLD lain dibandingkan 2 di seluruh pasar, sekitar tiga belas kali lebih banyak. Yang menjadi kesamaan nama premium adalah permintaan yang terbukti untuk string itu sendiri.
Sinyal mana yang mendominasi?
Tidak ada satu pun yang berlaku di mana-mana, dan itulah temuannya. Setiap sinyal bekerja di bagian pasar yang berbeda, itulah sebabnya tidak ada satu metrik pun yang bisa menentukan harga domain sendirian.
- Di seluruh pasar yang luas: usia paling erat mengikuti harga dalam hal peringkat (+0.43), terutama karena nama yang benar-benar baru mengelompok di rentang harga yang lebih rendah.
- Pada tingkat premium: usia dan tautan berhenti membedakan, dan permintaan lintas TLD serta keringkasan mengambil alih. Penjualan median $5,000+ tidak lebih tua dan tidak lebih banyak tertaut dibanding penjualan median $19. Panjangnya separuh dan terdaftar di sekitar tiga belas kali lebih banyak ekstensi.
- Panjang adalah yang paling tidak biasa dari keempatnya: itu tidak menunjukkan korelasi dengan harga secara keseluruhan, karena median datar di setiap bucket panjang, namun menghasilkan pergeseran paling tajam dari karakteristik apa pun di tingkat premium. Panjang tidak menentukan harga penjualan tipikal; itu memilih yang luar biasa.
Kesimpulan
Q2 2026 adalah cerita tentang harga dan komposisi. Domain tipikal terjual dengan harga hampir sama seperti setahun lalu, dengan median $18.87, sementara pergerakan rata-rata mencerminkan campuran yang bergeser ke inventaris berharga lebih rendah.
Di bawah headline yang stabil itu, nilai berada di kedua ujung pasar. 88.9% pesanan di bawah $50 dan kurang dari 1% pada $1,000 atau lebih menghasilkan nilai yang kira-kira sama.
Yang membedakan puncak pasar adalah struktur. Nama premium pendek, bersih, dan sudah terdaftar di banyak ekstensi lain, sementara usia dan backlink menunjukkan korelasi terbatas dengan penjualan tipikal. Permintaan yang terbukti untuk string itu sendiri menentukan domain termahal kuartal ini.